Top 100 Chemical Manufacturing Companies Ranking 2025

Values in USD Million

Ranking Company Sales 2024 %Change in comparison
to 2023
EBIT/Operating
Income 2024
%Change in comparison
to 2023
Net Income %Change in comparison
to 2023
Total Assets %Change in comparison
to 2023
Capex 2024 %Change in comparison
to 2023
R&D 2024 %Change in comparison
to 2023
1 Sinopec1 71769 1.7% 1370 -265.6% 36767 5.1% 6119 -18.8%
2 BASF 68125 -5.3% 2122 0.0% 1517 283.0% 83945 3.9% 6259 15.4% 2151 -3.2%
3 Dow 42964 -3.7% 1600 143.9% 1201 82.0% 57312 -1.1% 2940 24.8% 810 -2.3%
4 LyondellBasell 40302 -2.0% 1367 -35.5%
5 SABIC1 37300 -1.1% 720 1250.0% 600 71.4% 74400 -5.6% 2507 5.1%
6 LG chem 33263 -11.5% 623 -63.7% 0.3 -74.9% 1 -31.2% 0 3.0%
7 Sherwin-Williams 23099 0.2% 2681 12.2% 23633 3.0% -1070 20.4%
8 Henkel 22534 0.3% 2955 40.8% 2121 51.6% 36815 11.2% 2069 77.0% 662 8.0%
9 INEOS 16890 8.7% 1162 57.4% 25859 21.6% 1826 20.6% 47 8.2%
10 Johnson Matthey 16074 -14.0% 312 -38.7% 135 -60.9% 7930 -9.9% 488 28.7% 255 -4.2%
11 PPG 15845 -2.4% 1116 -12.1% 19433 -10.2% 721 37.1% 423 -0.2%
12 Evonik 15822 -0.7% 602 -323.9% 232 -148.0% 20617 -1.0% 852 -5.1% 479 3.6%
13 Toray2 15773 -1.0% 369 -47.1% 22186 8.5%
14 Mitsubishi Chemical1,2 15764 -7.4% -84 18141 6.5% 928 -1.8%
15 Ecolab 15741 2.8% 2802 41.0% 2112 53.9% 22388 2.5% 995 28.4% 207 7.8%
16 Indorama Ventures 15706 0.0% -177 -556 5339 -8.2%
17 Sumitomo Chemicals2 15660 -15.5% -2962 -2979 25183 -5.5%
18 Shin-Etsu Chemical2 15456 -14.0% 4487 -29.8% 3329 -26.6% 32947 8.8% 2604 27.9% 421 -2.1%
19 Covestro 14801 -1.4% 91 -53.2% -278 14229 0.0% -409
20 Sasol1,3 14553 -5.0% 1444 26.9% -2341 19307 -15.9%
21 Lotte Chemical 13893 2.4% -608 -1241 23496 3.2% 101 23.1%
22 AGC 13233 2.4% 805 -2.3% 133 -81.6% 18494 -1.5% 1648 11.1%
23 Sika 12957 4.7% 1888 10.6% 1374 17.4%
24 Braskem 12517 9.7% -1949 16425 10.7% 75 20.9%
25 DuPont 12386 2.6% 738 59.7% 36636 -5.0% 579 -6.5% 531 4.5%
26 Chevron Phillips Chemical 12105 4.7% 1726 47.1% 20659 4.8%
27 IFF 11484 0.0% 766 247 28667 -7.5% 463 8.0% 671 5.0%
28 Mitsui Chemicals2 11198 -6.9% 616 -15.5% 320 -39.7% 14181 7.1% 1188 10.5% 286 4.1%
29 AkzoNobel 11181 0.4% 957 -10.9% 618 22.6% 15197 2.2% 319 7.0% 309 9.6%
30 Bayer1 10716 -6.4%
31 Nippon Paint 10488 13.6% 1201 11.2% 824 8.1% 19657 13.2% 485 52.0%
32 Celanese 10280 -6.0% -697 -1514 22857 -14.1% -130 -11.0%
33 Arkema 9963 0.3% 612 -14.0% 373 -16.0% 15877 4.8% 794 20.0% 290 1.1%
34 Eastman Chemical 9382 1.9% 1278 -1.8% 908 1.3% 15213 4.0% 599 -27.7% 250 4.6%
35 Borealis 8197 10.9% 357 590 173.7% 13262 -3.8% 15 13.0%
36 Givaudan 8164 7.2% 1535 25.0% 1201 22.1% 13327 8.7%
37 Asahi Kasei1,2 8075 -4.2% 272 3.8%
38 Westlake Chemical1 7825 -6.1% 129 118.6%
39 Alpek 7530 -3.0% 295 -2 5759 -5.3% 41 -63.0%
40 Orbia Advance 7506 -8.5% 439 -48.3% 145 123.0% 11057 -4.3% 447 -35.8%
41 Corteva1 7363 -5.0%
42 RPM International4 7335 1.1% 788 21.3% 589 23.0% 6587 -2.8% 214 -21.6%
43 Lonza 7241 -2.1% 1062 9.5% 702 -2.8% 21736 17.0% 1561 -15.8%
44 Petronas Chemicals Group1 6855 7.0% 460 -4.6% 288 -26.3% 13414 -0.3%
45 LANXESS 6645 -5.2% -29 -185 10137 0.5% 383 -8.3% 109 5.1%
46 Olin 6540 -4.3% 297 -95.5% 105 -76.8% 7579 -1.7% 195 -17.4% 18 -8.0%
47 Honeywell1 6425 3.0% 1522 2.0% 27908 18.8% 1536 5.5%
48 Huntsman 6036 -1.2% -25 -189 7114 -1.9% 184 -20.0%
49 Borouge 6026 4.1% 1921 20.3% 1239 23.8% 8707 -2.6%
50 Wacker 5972 10.6% 303 -28.4% 272 -20.3% 9823 6.3% 695 -6.1% 213 10.6%
51 ICL (Israel Chemicals Limited)1 5821 -11.8% 736 -29.7%
52 Chemours 5782 -4.8% -127 86 7515 -9.0% 360 -2.7% 109 1.0%
53 Exxonmobile1 5629 29.4%
54 Albemarle 5378 -44.1% -1777 -1179 16610 -9.1% 1686 -21.6% 87 1.2%
55 Solvay 5355 -14.8% 452 -35.8% 243 -24.2% 6988 4.7% 362 35
56 Kuraray 5292 5.9% 545 12.7% 200 -26.3% 3618 2.5%
57 Axalta Coating Systems 5276 1.8% 706 20.1% 391 45.9% 7249 -0.3% 74 0.0%
58 Tosoh1,2 5138 -9.1% 334 -2.8%
59 Nouryon Chemicals Holding B.V. 5129 1.1%
60 Teijin1,2 4951 0.1%
61 Occidental Chemical1 4923 -7.5%
62 Kaneka1,2 4879 0.9% 209 -7.1% 159 2.9% 5569 11.2% 443 55.9% 227 8.4%
63 Orica5 4739 -3.6% 498 15.4% 346 122.3% 5936 9.5% 282 3.8%
64 Clariant 4573 -5.1% 485 56.0% 308 56.4% 4316 15.9% 139 27.0%
65 PTT Global Chemical 4528 -16.5% -242 -870 18729 -10.2%
66 Formosa Plastic Corp 4454 -2.8% -76
67 FMC 4246 -5.4% 507 -8.8% 342 11653 -2.3% 68 -49.2% 278 -15.5%
68 Cabot5 3931 -1.6% 701 15.5% 424 -12.4% 3736 3.7% 235 9.8% 63 10.5%
69 Methanex 3720 -0.1% 250 -12.0% 6597 2.6%
70 FUCHS PETROLUB 3680 -0.5% 453 5.1% 2725 7.7%
71 Daicel2 3572 3.7% 399 31.3% 357 37.2% 5371 9.6% 496 37.6% 150 6.9%
72 H.B. Fuller 3569 1.6% 348 -1.9% 130 -10.1% 4933 4.4% 139 17.0% 50 2.0%
73 Trinseo 3513 -4.4% -46 -348 2644 -12.7% 63 -9.2%
74 Resonac1 3311 1.1% 61 1.8%
75 Hanwha Solutions1 3276 -5.5% -82
76 Incitec Pivot1,5 3265 2.3% -296 3866 -28.8% 256 14.9%
77 Entegris 3241 -8.0% 534 7.0% 293 62.1% 8395 -4.7% 316 14.0%
78 Avient 3240 3.1% 329 67.3% 171 123.7% 5811 -2.6% 122 2.1%
79 Kemira 3077 -12.9% 379 8.0% 274 24.3% 3529 -3.1% 178 -17.6% 35 0.0%
80 Tronox 3074 7.9% 219 17.7% -54 -82.8% 6038 -1.6% 370 41.8%
81 Ube1,2 2997 -5.3% 144 37.9% 5050 7.7%
82 NewMarket 2787 -3.2% 590 22.1% 462 -15.9% 3130 35.5% 57 18.8% 125 -9.5%
83 Tessenderlo 2764 -9.6% 67 -46.8% 60 -34.5% 3064 0.7% 189 1.1% 30 2.4%
84 JSR2 2590 1.0% 23 87.6% -29 4937 7.5% 202 -27.9% 166 11.8%
85 Nippon Shokubai2 2509 -6.6% 106 -29.6% 3482 4.0%
86 Denka2 2491 -4.5% 86 -58.6% 76 -6.4% 3944 4.1%
87 Synthomer 2486 2.4% -30 -87 3175 -6.3% 104 -1.0%
88 Zeon2 2447 -1.6% 131 -24.6% 199 194.3% 3406 1.8%
89 Ashland 2391 9.1% -26 169 -5.1% 5645 -5.0% 137 -19.4% 55 7.8%
90 Petkim 2190 11.3% -241 -192 768 -7.6%
91 Minerals Technologies 2119 -2.4% 287 66.8% 171 93.5% 3394 1.4% 90 -4.3% 23 8.5%
92 Kronos Worldwide 1887 13.2% 123 86 1932 5.1% 30 -37.8% 14 -22.2%
93 Orion Engineered Carbon 1878 -0.9% 103 -50.0% 44 -57.3% 1857 1.3% 429 -4.9% 27 10.6%
94 Innospec 1845 -5.3% 178 10.1% 36 -74.4% 1735 1.6% 41 -33.3% 48 14.6%
95 Quaker Chemical 1840 -5.8% 195 -9.2% 117 3.3% 2611 -3.8% 50
96 Tata Chemicals 1804 -8.0% 15 -48.0% 243 16.2%
97 AdvanSix 1518 1.0% 44 -19.2% 1595 6.6% 24 4.3%
98 OCI 1506 9.5% 75 7.6% 61 -46.8% 1552 14.7%
99 Ingevity 1406 -16.9% -430 2023 -22.9% 78 -29.3% 28 -11.6%
100 SK Global Chemical 1181 -0.7% -31 -3 3650 29.1% 31 2.2%
  • 1Only Chemicals Segment
  • 2Year ending March 2024
  • 3Year ending June 2024
  • 4Year Ending May 2024
  • 5Year ending September 2024

In 2024, global economic growth slowed to 2.7%, impacted by geopolitical tensions, inflationary pressures, and regional recovery disparities. The U.S. economy grew at 2.3%, bolstered by consumer spending and a strong labor market, despite challenges like high interest rates and inflation. China's growth moderated to 4.8%, hindered by weak demand and a struggling property sector, despite stimulus efforts. The Eurozone saw sluggish growth of 0.9%, with Germany contracting by 0.2% due to structural issues, while Spain performed better at 1.9%.

The UK’s economy stagnated at 0.5%, weighed down by high interest rates and weak business activity. In contrast, India thrived with a 6.3% growth, driven by strong domestic demand and infrastructure investments. The petrochemical industry faced severe challenges in 2024, primarily due to oversupply and sluggish demand. This led to significant margin compression and profitability struggles, particularly in Asia. Weak demand in key sectors like automotive, construction, and consumer goods, alongside oversupplied markets, continued to drag on performance. As a result, companies deferred capital expenditure, focusing on efficiency and mergers rather than new capacity investments. Despite these challenges, some regions, particularly the Middle East, with lower energy costs, saw better performance. Overall, 2024 was marked by uneven global recovery, with emerging markets like India leading, while the petrochemical sector remained under pressure, signaling a need for strategic adjustments amid ongoing economic volatility. This report delves into the financial performance of the top 100 chemical manufacturing companies in 2024, focusing on key financial indicators.

It examines how these global economic conditions and industry-specific challenges influenced the strategic decisions and financial outcomes of key players, providing valuable insights into the competitive dynamics and prospects of the sector.

Top Performers

ChemAnalyst has conducted a comprehensive analysis and ranking of companies based on their performance, considering key indicators such as net income, operating income, total assets, capital expenditures (Capex), and research and development (R&D) expenses in 2024 compared to 2023.

The performance of the leading chemical companies in 2024 has been marked by significant financial outcomes, driven by varying factors across different market conditions and geographies. Here, we delve into the financial performance of some of the top chemical companies, shedding light on their net income, key achievements, and challenges faced during the year.

Top 10 By Operating Income/EBIT 2024
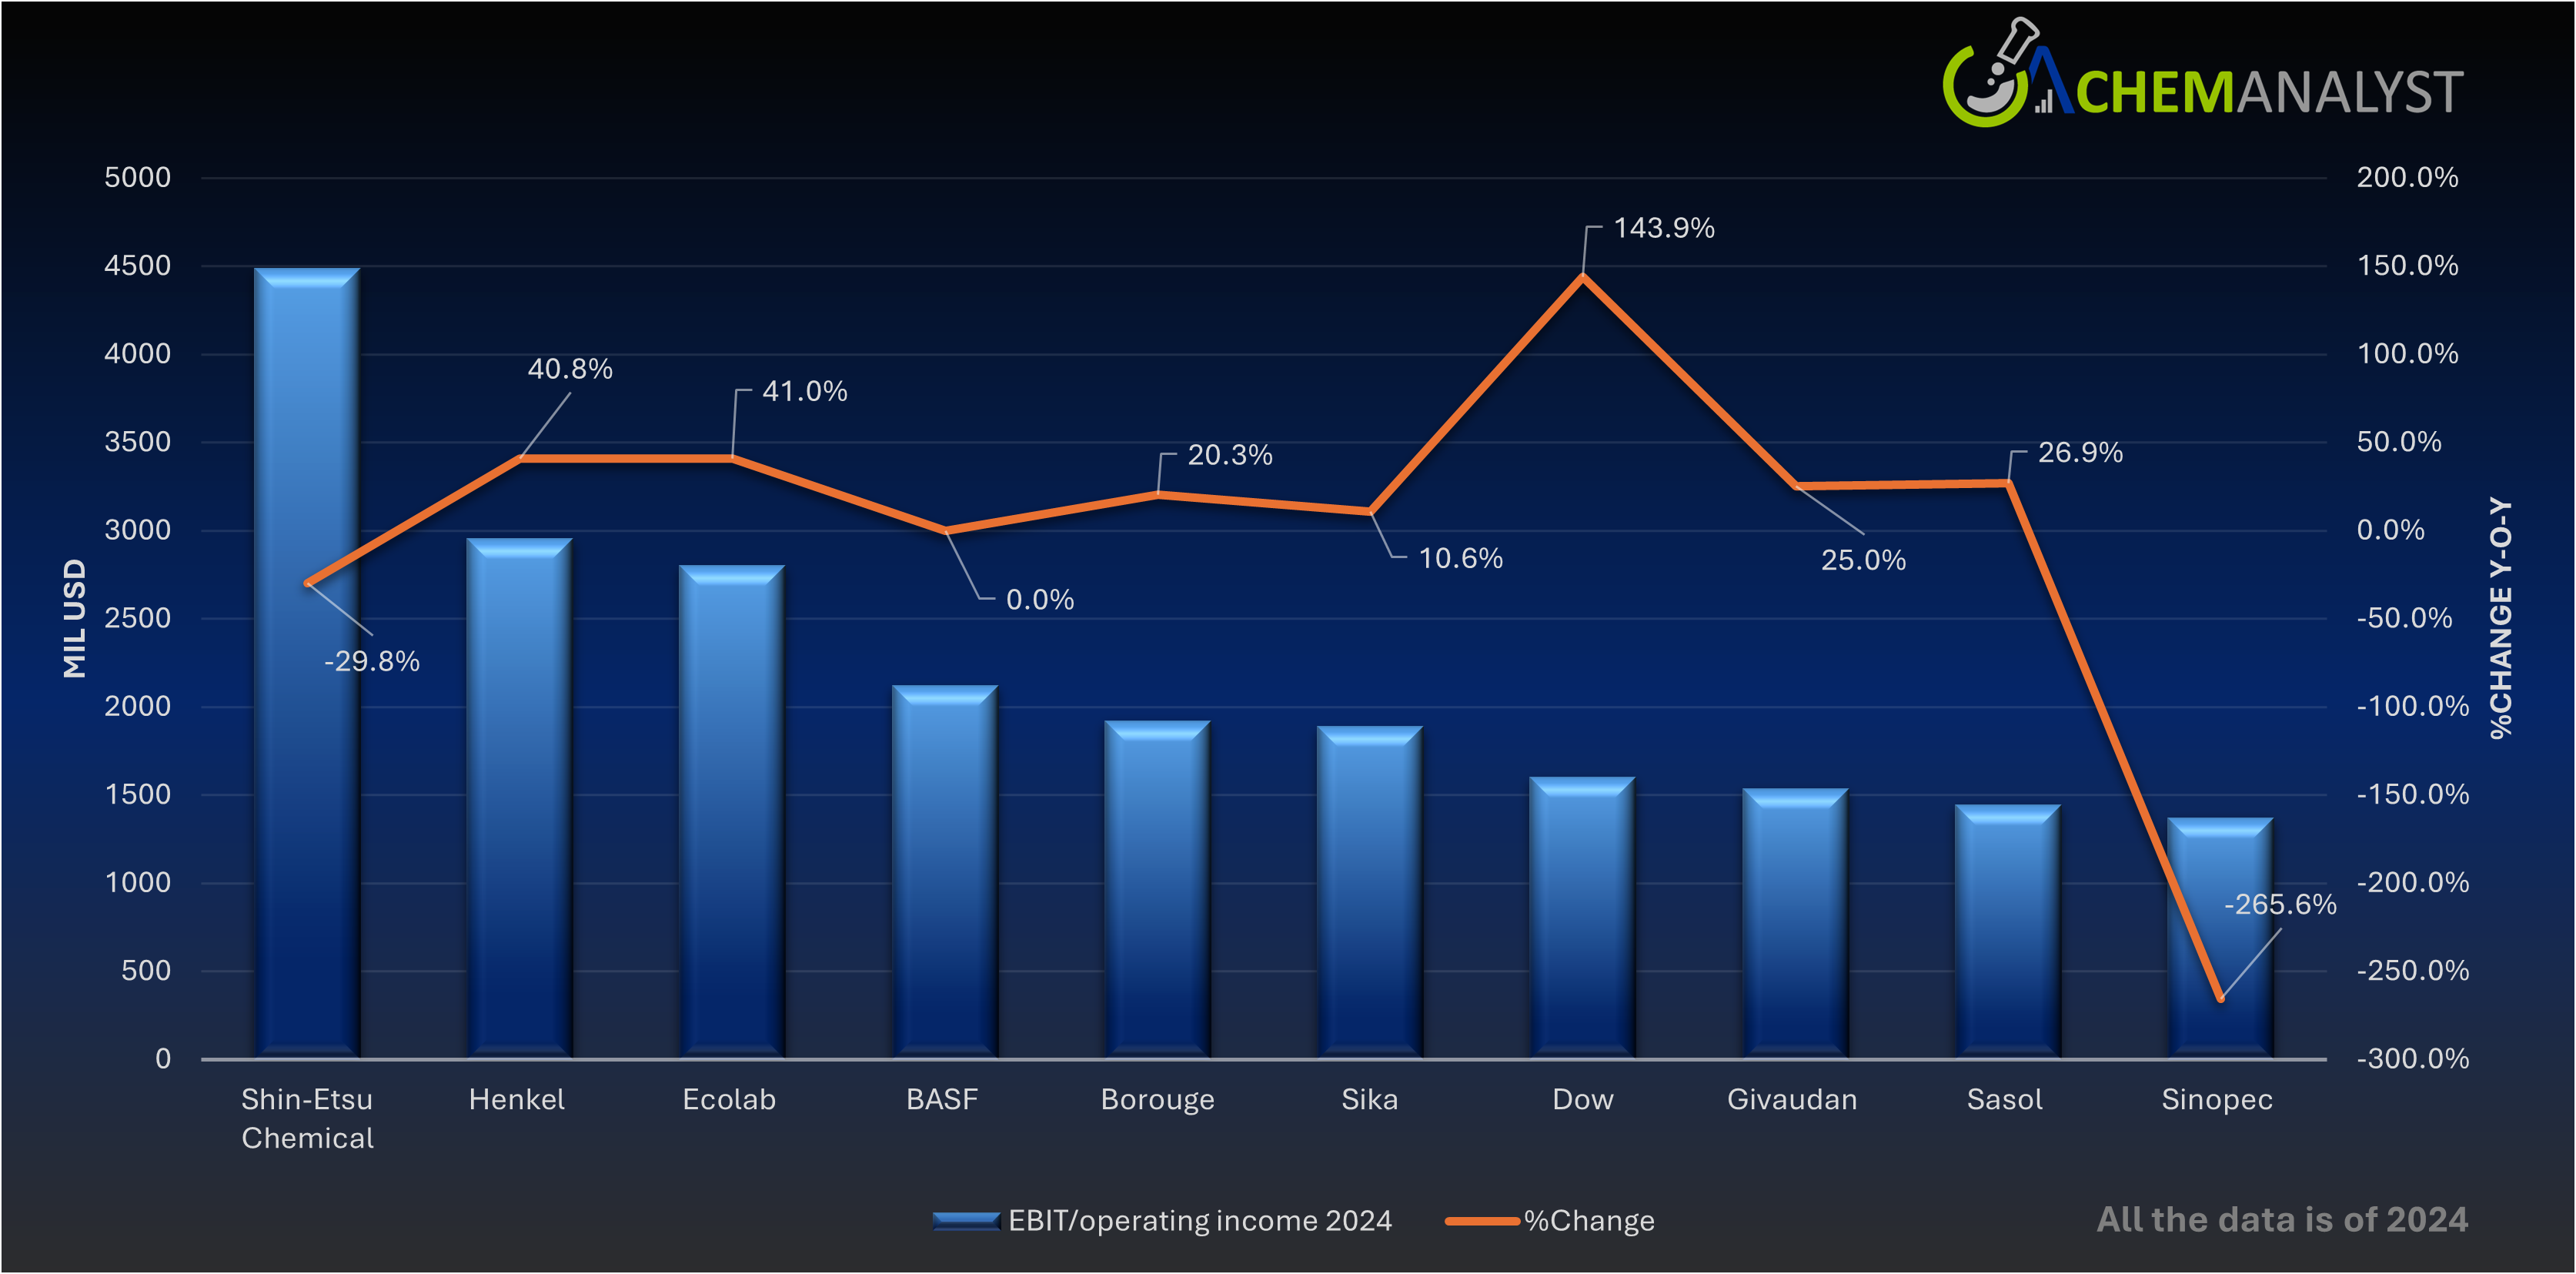
Top 10 By Operating Income

In 2024, Albemarle Corporation experienced a significant decline in net sales, falling to $5,377.5 million, a 44% drop from the previous year. The company reported a net loss of $1,135.5 million, reversing its net income of $1,573.5 million in 2023. This downturn was largely driven by a 53% decrease in lithium prices, a result of global oversupply, reduced electric vehicle adoption, and heightened competition from Chinese producers. Additional impacts came from restructuring charges and asset write-offs. Despite these challenges, Albemarle achieved adjusted EBITDA of $1,139.8 million by implementing cost improvements and growing volumes in other segments. To navigate the difficult market conditions, the company executed cost-cutting measures, including workforce reductions and capital expenditure cuts, while optimizing its conversion network to bolster financial flexibility.

In 2024, INEOS Group Holdings reported revenues of approximately $17.6 billion, marking an 8.6% increase from $16.2 billion in 2023. Despite an operating profit increase to $1.21 billion (from €1.11 billion), the company faced a pre-tax loss of $77.5 million due to substantial debt-related finance costs exceeding $1.2 billion. This financial strain led to the suspension of annual dividends; a move supported by major shareholders to reinvest in the business. INEOS's challenges were compounded by a global oversupply in the petrochemical sector, reduced demand in Asia, and the impact of U.S. trade tariffs. Additionally, unforeseen events like a hurricane-induced shutdown in Texas and an unscheduled outage at the Lavera cracker in France affected operations. To navigate these challenges, INEOS focused on strategic acquisitions, including assets from LyondellBasell and TotalEnergies, and emphasized cash management and liquidity, maintaining cash balances of approximately $2.4 billion by the end of September 2024.

In 2024, LG Chem posted consolidated revenues of approximately $33.9 billion USD (₩48.92 trillion), reflecting an 11.5% decline from the previous year, amid prolonged global petrochemical oversupply and weakened demand in China. Net income plummeted by 74.9% to around $351 million USD, while operating profit dropped 63.8% to $636 million USD. The sharp downturn was driven by a sluggish electric vehicle market impacting battery material sales and margin pressure in core petrochemical segments. In response, LG Chem ramped up its portfolio transformation, prioritizing high-value growth areas like sustainable materials, advanced battery components, and biopharma innovation. Strategic capital expenditure cuts and business optimization efforts were key to maintaining operational resilience during a year of significant headwinds

In 2024, Wacker Chemie AG reported revenues of approximately $5.97 billion USD (€5.72 billion), marking an 11% decline from the previous year, primarily due to decreased prices and volumes in its polysilicon division. The company faced challenges such as high energy costs in Germany and subdued demand in key sectors like construction and automotive. Despite these hurdles, Wacker achieved an EBITDA of $801 million USD (€770 million), a 7% decrease year-over-year, and a net income of $271 million USD (€265 million), down 20%. Capital expenditure was reduced by 6% to $692 million USD (€665 million), focusing on capacity expansions across all business divisions. Total assets increased by 6.3% to $9.78 billion USD (€9.41 billion), while R&D expenses rose by 10.6% to $212 million USD (€203.7 million), underscoring the company's commitment to innovation amidst challenging market conditions.

In 2024, SABIC’s Chemical segment—the company’s largest revenue driver—faced a significant financial decline amid a challenging global market. Annual revenue for the segment dropped by 22% to SAR 102.3 billion from SAR 130.6 billion in 2023, primarily due to weaker demand and lower average selling prices across key product categories such as olefins, aromatics, and polyolefins. The segment's earnings before interest and taxes (EBIT) turned negative, posting a loss of SAR 1.0 billion in Q1 2024 compared to a profit of SAR 0.3 billion in Q1 2023. Correspondingly, the EBIT margin deteriorated to -4.6% from +1.1% year-on-year. Total segment assets also declined to SAR 206.8 billion from SAR 212.7 billion over the same period. Despite margin compression and headwinds from feedstock cost pressures and global overcapacity, SABIC continued to prioritize operational efficiency, innovation, and sustainability within its Chemical business to reinforce long-term resilience.

Top 10 Increments in Operating Income

Top 10 Increments in Opetating Income

Based on the latest financial disclosures from key players among the top 10 global chemical companies by operating income in 2024, the performance landscape was marked by mixed outcomes, shaped by macroeconomic volatility, cost discipline, and strategic focus on core markets. Here is a synthesized insight highlighting the financial and strategic performance of Dow, Westlake Corporation, and JSR Group:

In 2024, top-performing chemical companies demonstrated a disciplined focus on cost control, strategic investments, and portfolio optimization to navigate a challenging global landscape defined by weak industrial demand, inflationary pressures, and geopolitical instability.

Dow reported strong operating performance with Earning before Income Tax of approximately $1.6 billion, underpinned by its cost-advantaged feedstock position in the Americas and the Middle East. The company highlighted five consecutive quarters of volume growth, showcasing resilient demand capture through innovation and operational discipline. Despite navigating the bottom of the petrochemical cycle, Dow’s solid cash flow from operations ($2.9 billion) and consistent shareholder returns (~$2.5 billion) underline its robust balance sheet and disciplined capital allocation. Looking ahead, Dow emphasized readiness to invest in high-return projects and sustainable innovation, supporting long-term growth and leadership in materials science.

Westlake Corporation achieved a 23% increase in net income to $602 million, primarily driven by the absence of large impairment and litigation charges that impacted 2023. However, excluding these one-off effects, the company faced margin pressures from significantly lower average sales prices (down 10%) across major products such as PVC resin, caustic soda, and epoxy. Operating income rose to $129 million, supported by higher sales volumes and lower energy and feedstock costs, though partially offset by restructuring expenses related to the mothballing of Netherlands-based units. Westlake’s performance illustrates the balancing act between cost savings and demand softness in essential materials markets.

JSR Group navigated a year of subdued consumer electronics demand and global economic uncertainty, with its Plastics Business posting a 21.2% drop in core operating income. Nonetheless, the company maintained profitability through improvements in unit prices. JSR remains forward-looking, doubling down on semiconductor materials and life sciences, where it sees resilient mid-to-long-term growth. With ongoing investments in EUV photoresists and OLED-related display materials, JSR is positioning itself to benefit from the digital infrastructure boom, despite current headwinds in key markets.

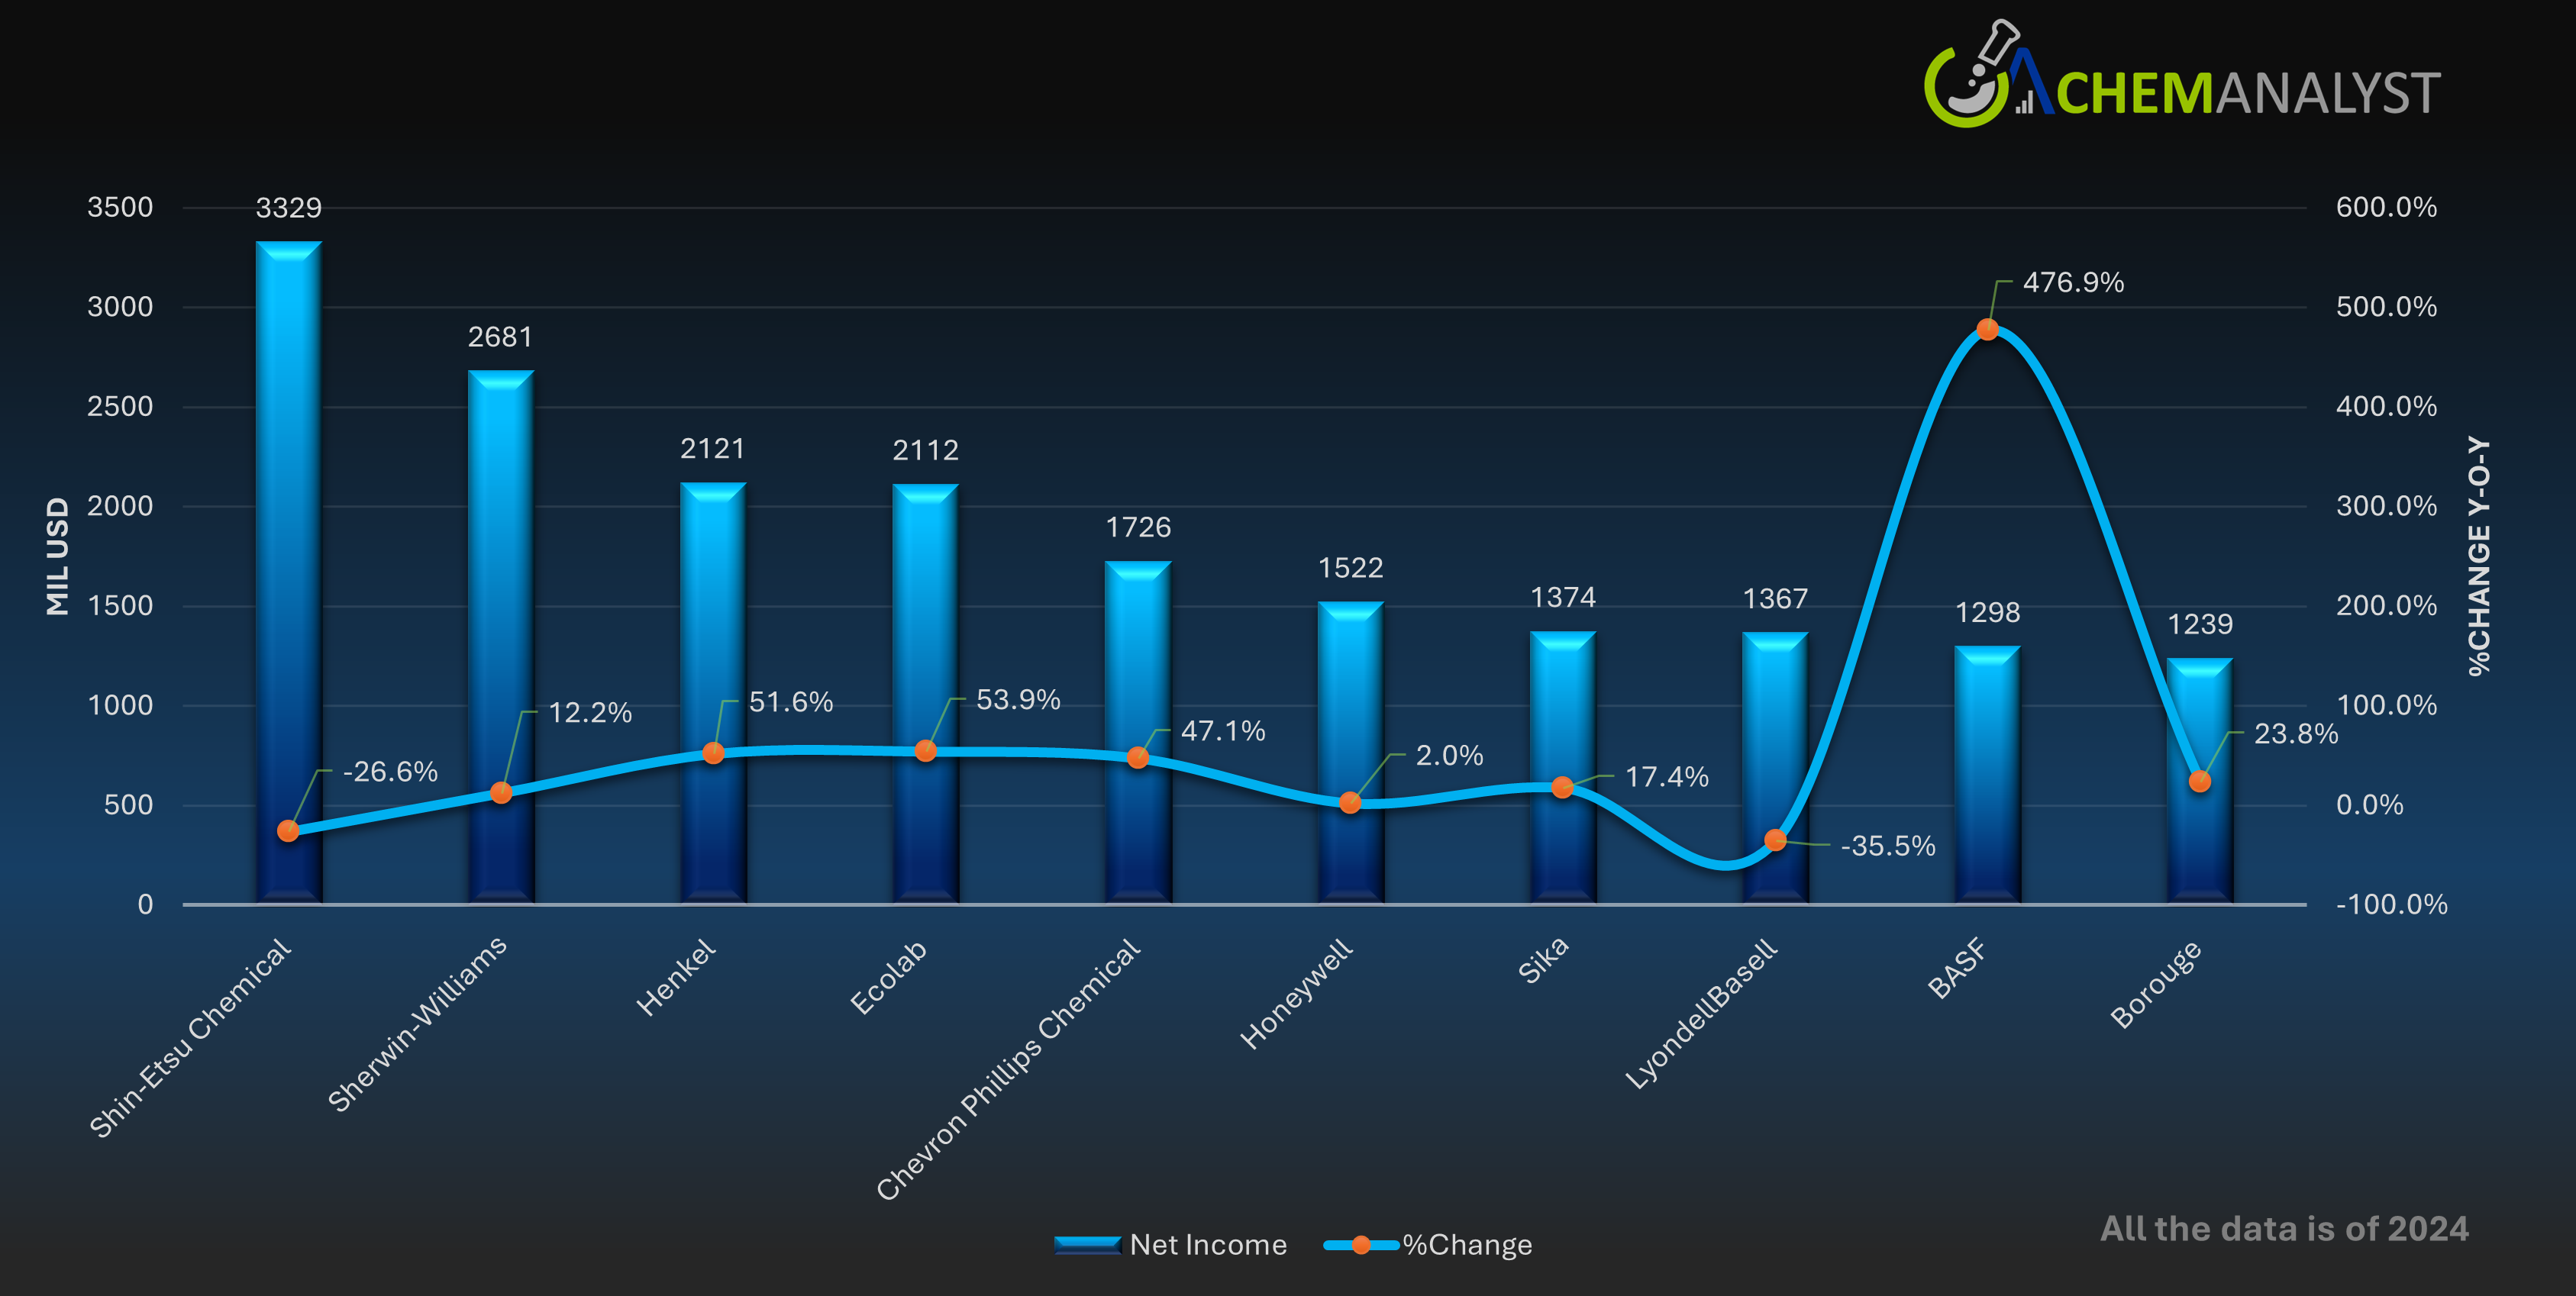
Top 10 by Net Income

Top 10 by Net Income
1) Shin-Etsu Chemical

In FY 2024, Shin-Etsu Chemical experienced a 14% decline in net sales and a 29.8% drop in operating income, following an exceptionally strong FY 2023. Net income attributable to owners fell 26.6% to ¥520,140 million, though margins remained healthy. The company raised capital expenditure by 28% to ¥406,886 million, focusing on capacity expansion in PVC and semiconductors. Total assets rose to ¥5.15 trillion, while the equity ratio improved to 82.7%, reflecting robust financial health. Despite profit pressures, the ¥100 dividend was maintained, demonstrating confidence in long-term shareholder value.

Key Points:
  • 1.) Net income declined from ¥708,238M to ¥520,140M (26.6%)
  • 2.) Capex increased from ¥318,046M to ¥406,886M (27.9%)
  • 3.) Equity ratio rose from 81.8% to 82.7%
2) Sherwin-Williams

In FY 2024, Sherwin-Williams reported net sales of $23,098.5 million, nearly flat year-on-year. Gross profit rose 4.1% to $11,195.1 million, improving margin to 48.5%, up from 46.7% in 2023. Net income increased 12.3% to $2,681.4 million, driven by controlled SG&A expenses and reduced non-operating costs. Operating cash flow stood at $3,153.2 million, slightly lower than $3,521.9 million in 2023. Capital expenditures grew to $1,070 million, while free cash flow remained strong. Total assets rose to $23,632.6 million, and shareholders’ equity improved to $4,051.2 million. A $2.86/share dividend was paid, up from $2.42/share in 2023.

Key Points:
  • 1.) Net income rose 12.3% to $2,681.4M.
  • 2.) Gross margin improved to 48.5% despite flat revenue.
  • 3.) Dividend increased 18% to $2.86/share, with strong equity growth to $4.05B.
3) Henkel delivered

In FY 2024, Henkel delivered a resilient performance amid global challenges, with sales reaching €21,586 million, a slight increase of 0.3% YoY. Operating profit (EBIT) surged 40.8% to €2,831 million and adjusted EBIT rose 20.9% to €3,089 million, lifting the EBIT margin to 13.1%. Net income grew 51.7% to €2,032 million, with EPS climbing to €4.80, a 52.4% increase. Return on capital employed (ROCE) advanced to 12.9%, and Henkel raised its dividend per preferred share to €2.04. This performance reflects Henkel’s successful transformation and disciplined execution in a volatile macroeconomic environment.

Key Points:
  • 1.) Operating profit jumped 40.8% to €2,831 million.
  • 2.) Net income rose 51.7% to €2,032 million; EPS up 52.4% to €4.80.
  • 3.) Dividend per preferred share increased to €2.04 (10.3%).

Top 10 Increments in Net Income

Top 10 Increments in Net Income

In 2024, BASF SE reported sales revenue of €65,260 million, down from €68,902 million in 2023. Operating income (EBIT) declined slightly to €2,033 million from €2,240 million. R&D spending stood at €2,061 million, showing ongoing commitment to innovation. Net income attributable to shareholders increased substantially to €1,298 million, compared to €225 million in 2023, driven by cost savings and improved shareholding results. Net cash from operating activities was supported by steady core operations. Despite weaker sales, BASF improved bottom-line profitability, demonstrating financial resilience amid ongoing market challenges and lower cost of sales.

In FY 2024, Zeon Corporation reported sales of $2446.6 million, reflecting a 1.6% decline from FY2023’s $2487.1 million. Operating income fell sharply by 24.6% year-on-year to $131 million, impacted by rising raw material costs and subdued demand in certain business segments. However, net income surged by 194.3% to $199 million, largely due to extraordinary gains of $163.2 million from the sale of investment securities, which supported overall profitability despite weaker core operations. Total assets grew modestly by 1.8% to $3406.4 million, indicating continued financial stability. Compared to FY2023, Zeon successfully strengthened its balance sheet, reduced cross-shareholdings, and optimized capital efficiency, aligning with its Medium-Term Business Plan targets.

In FY2024, Borealis delivered a strong rebound in financial performance. Sales increased by 10.87% to $8,197 million, supported by higher polyolefin and base chemical volumes. Operating income rose sharply to $357 million from just $6.2634 million in 2023, driven by improved margins, lower fixed costs, and the absence of major plant turnarounds. Net income soared by 173.7% to $590 million, bolstered by stronger contributions from joint ventures like Borouge and improved equity-accounted earnings. Despite a 3.77% decline in total assets to $13,262 million, the company maintained a solid financial position. R&D spending grew 13.04% to $15 million, reflecting Borealis’s focus on innovation and long-term growth. The improved 2024 safety record reflects progress toward the company’s “Zero Harm” goal. Looking ahead, safety remains a top priority for 2025 as Borealis pursues leadership in health, safety, and environmental protection under its “HSSE 2030” initiative, reaffirming its commitment to responsible and sustainable operations.

Top 10 by Total Assets

Top 10 by Total Assets

In FY 2024, BASF's total assets increased to €80.415 billion, up from €77.395 billion in FY 2023, marking a 3.9% year-over-year rise. This growth was primarily driven by a €3.26 billion increase in noncurrent assets, which totaled €49.183 billion at year-end. The expansion in noncurrent assets was largely due to significant investments in property, plant, and equipment, particularly the ongoing construction of the Zhanjiang Verbund site in China. Additions of €6.694 billion and favorable currency effects of €537 million contributed to this increase, despite depreciation and impairments totaling €3.978 billion.

Conversely, current assets experienced a slight decline of €240 million, settling at €31.232 billion. This decrease was mainly attributed to a reduction in inventories, particularly within the Agricultural Solutions segment, and lower values in precious metal trading items and tax refund claims. Overall, the rise in total assets reflects BASF's strategic investments in expanding its production capabilities and infrastructure, positioning the company for future growth despite challenging market conditions.

Key Points:
  • 1.) Asset Growth BASF’s total assets increased to €80.415 billion, up 3.9% from €77.395 billion in FY 2023.
  • 2.) Noncurrent Asset Expansion: The increase was driven by a €3.26 billion rise in noncurrent assets, primarily from investments in property, plant, and equipment, especially the Zhanjiang Verbund site in China.
  • 3.) Current Asset Decline: Despite the overall asset growth, current assets declined slightly by €240 million due to reduced inventories and lower tax refund claims.

In FY 2024, SABIC's total assets increased to SAR 294.48 billion, up from SAR 283.4 billion in FY 2023, marking a 3.9% year-over-year rise. This growth was primarily driven by a SAR 3.26 billion increase in noncurrent assets, which totaled SAR 49.183 billion at year-end. The expansion in noncurrent assets was largely due to significant investments in property, plant, and equipment, particularly the ongoing construction of the Zhanjiang Verbund site in China. Additions of SAR 6.694 billion and favorable currency effects of SAR 537 million contributed to this increase, despite depreciation and impairments totaling SAR 3.978 billion.

Conversely, current assets experienced a slight decline of SAR 240 million, settling at SAR 31.232 billion. This decrease was mainly attributed to a reduction in inventories, particularly within the Agricultural Solutions segment, and lower values in precious metal trading items and tax refund claims. Overall, the rise in total assets reflects SABIC's strategic investments in expanding its production capabilities and infrastructure, positioning the company for future growth despite challenging market conditions.

Key Points:
  • 1.) Total Asset Increase: SABIC’s total assets rose to approximately SAR 294.5 billion, representing a 3.9% increase from SAR 283.4 billion in FY 2023.
  • 2.) Investment-Driven Growth: The asset growth was supported by ongoing investments in strategic projects and infrastructure, aligning with long-term expansion goals.
  • 3.) Balance Sheet Strengthening: The increase in total assets reflects SABIC’s financial resilience, even amid a challenging global chemicals market, and positions the company for future stability and growth.

In FY 2024, Dow Inc. reported total assets of $57.31 billion, reflecting a modest 1.13% decline from $57.97 billion in FY 2023. This slight decrease was primarily due to a reduction in current assets, which fell from $17.61 billion to $16.59 billion, influenced by lower inventory levels and decreased receivables. Despite this, Dow continued to invest in its long-term growth, as evidenced by an increase in net property assets, which rose from $21.07 billion to $22.00 billion. The company's strategic focus on capital discipline and operational efficiency enabled it to maintain a stable asset base amidst challenging macroeconomic conditions.

Key Points:
  • 1.) Total Assets: $57.31 billion in FY 2024, down 1.13% from $57.97 billion in FY 2023.
  • 1.) Current Assets: Decreased by approximately $1.02 billion, primarily due to lower inventories and receivables.
  • 1.) Net Property Assets: Increased by $0.93 billion, indicating continued investment in long-term assets.

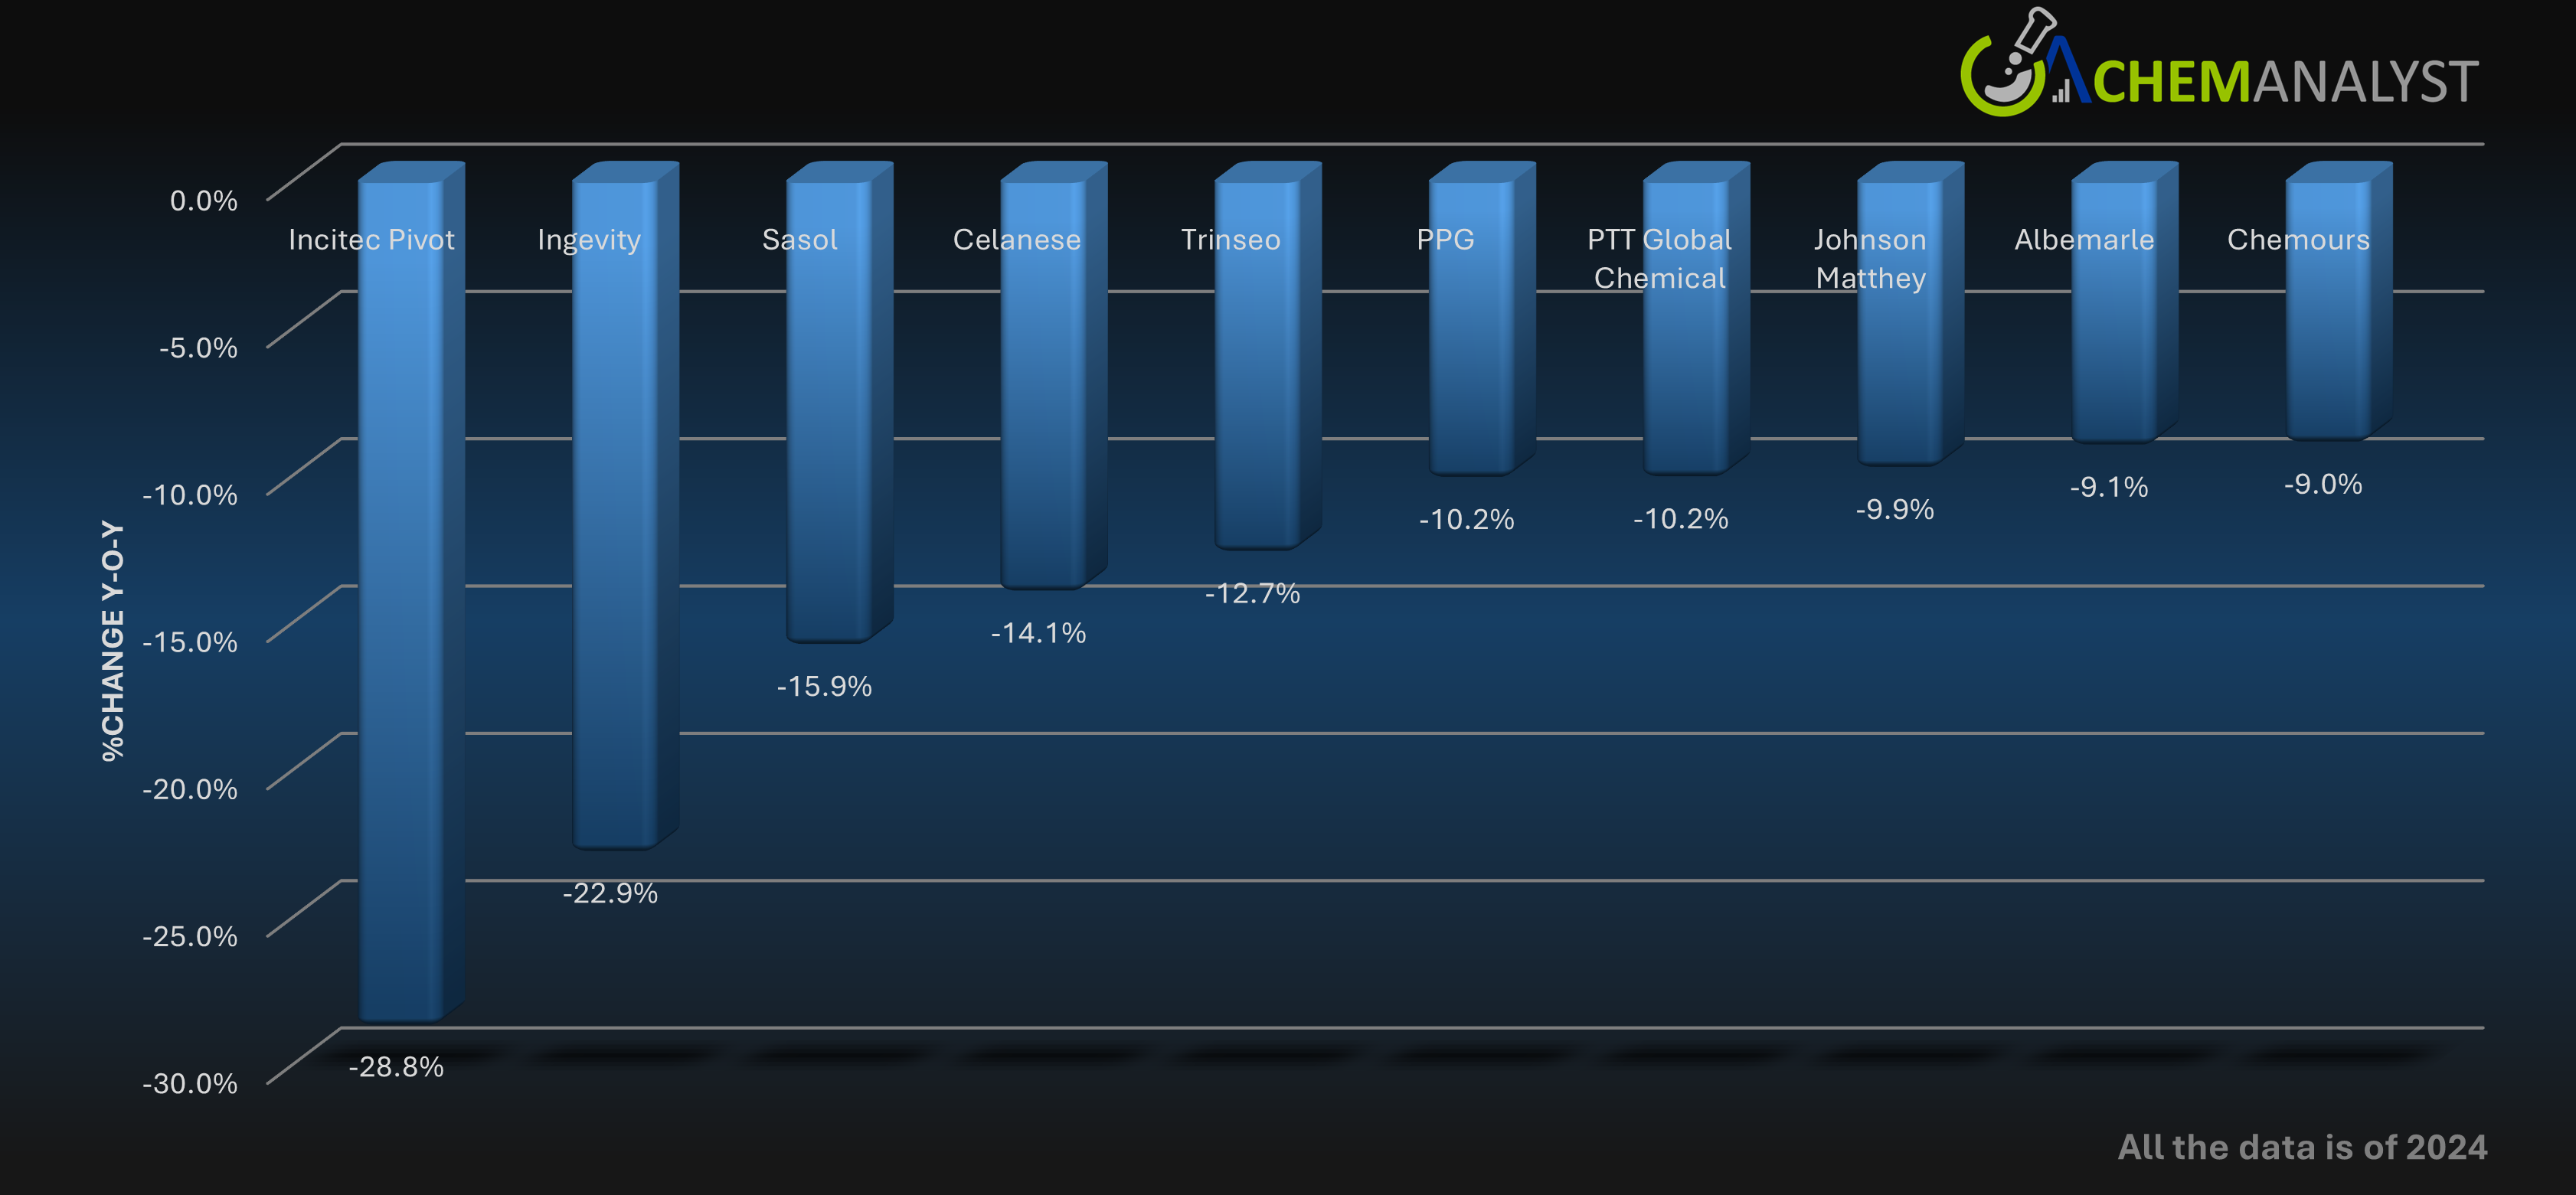
Top 10 decline in Total Assets

Top 10 decline in Total Assets

In FY 2024, Incitec Pivot's total assets decreased by 28.8%, from approximately AUD 5.43 billion in FY 2023 to AUD 3.87 billion. This significant reduction was primarily due to the sale of its ammonia production facility in Waggaman, Louisiana, to CF Industries. The divestment led to a substantial decrease in the company's asset base, aligning with its strategic focus on core businesses.

Ingevity reported a 22.9% decline in total assets, from $2.62 billion in FY 2023 to $2.02 billion in FY 2024. This decrease was largely attributed to a $349.1 million goodwill impairment charge within its Performance Chemicals segment, resulting from strategic repositioning efforts. The company exited lower-margin end markets, leading to a leaner asset structure.

Sasol's total assets declined by 15.9%, from ZAR 433.8 billion in FY 2023 to ZAR 365.0 billion in FY 2024. The reduction was driven by challenging macroeconomic conditions, including lower chemical prices and increased operational costs. Additionally, the company faced currency depreciation impacts and asset impairments.

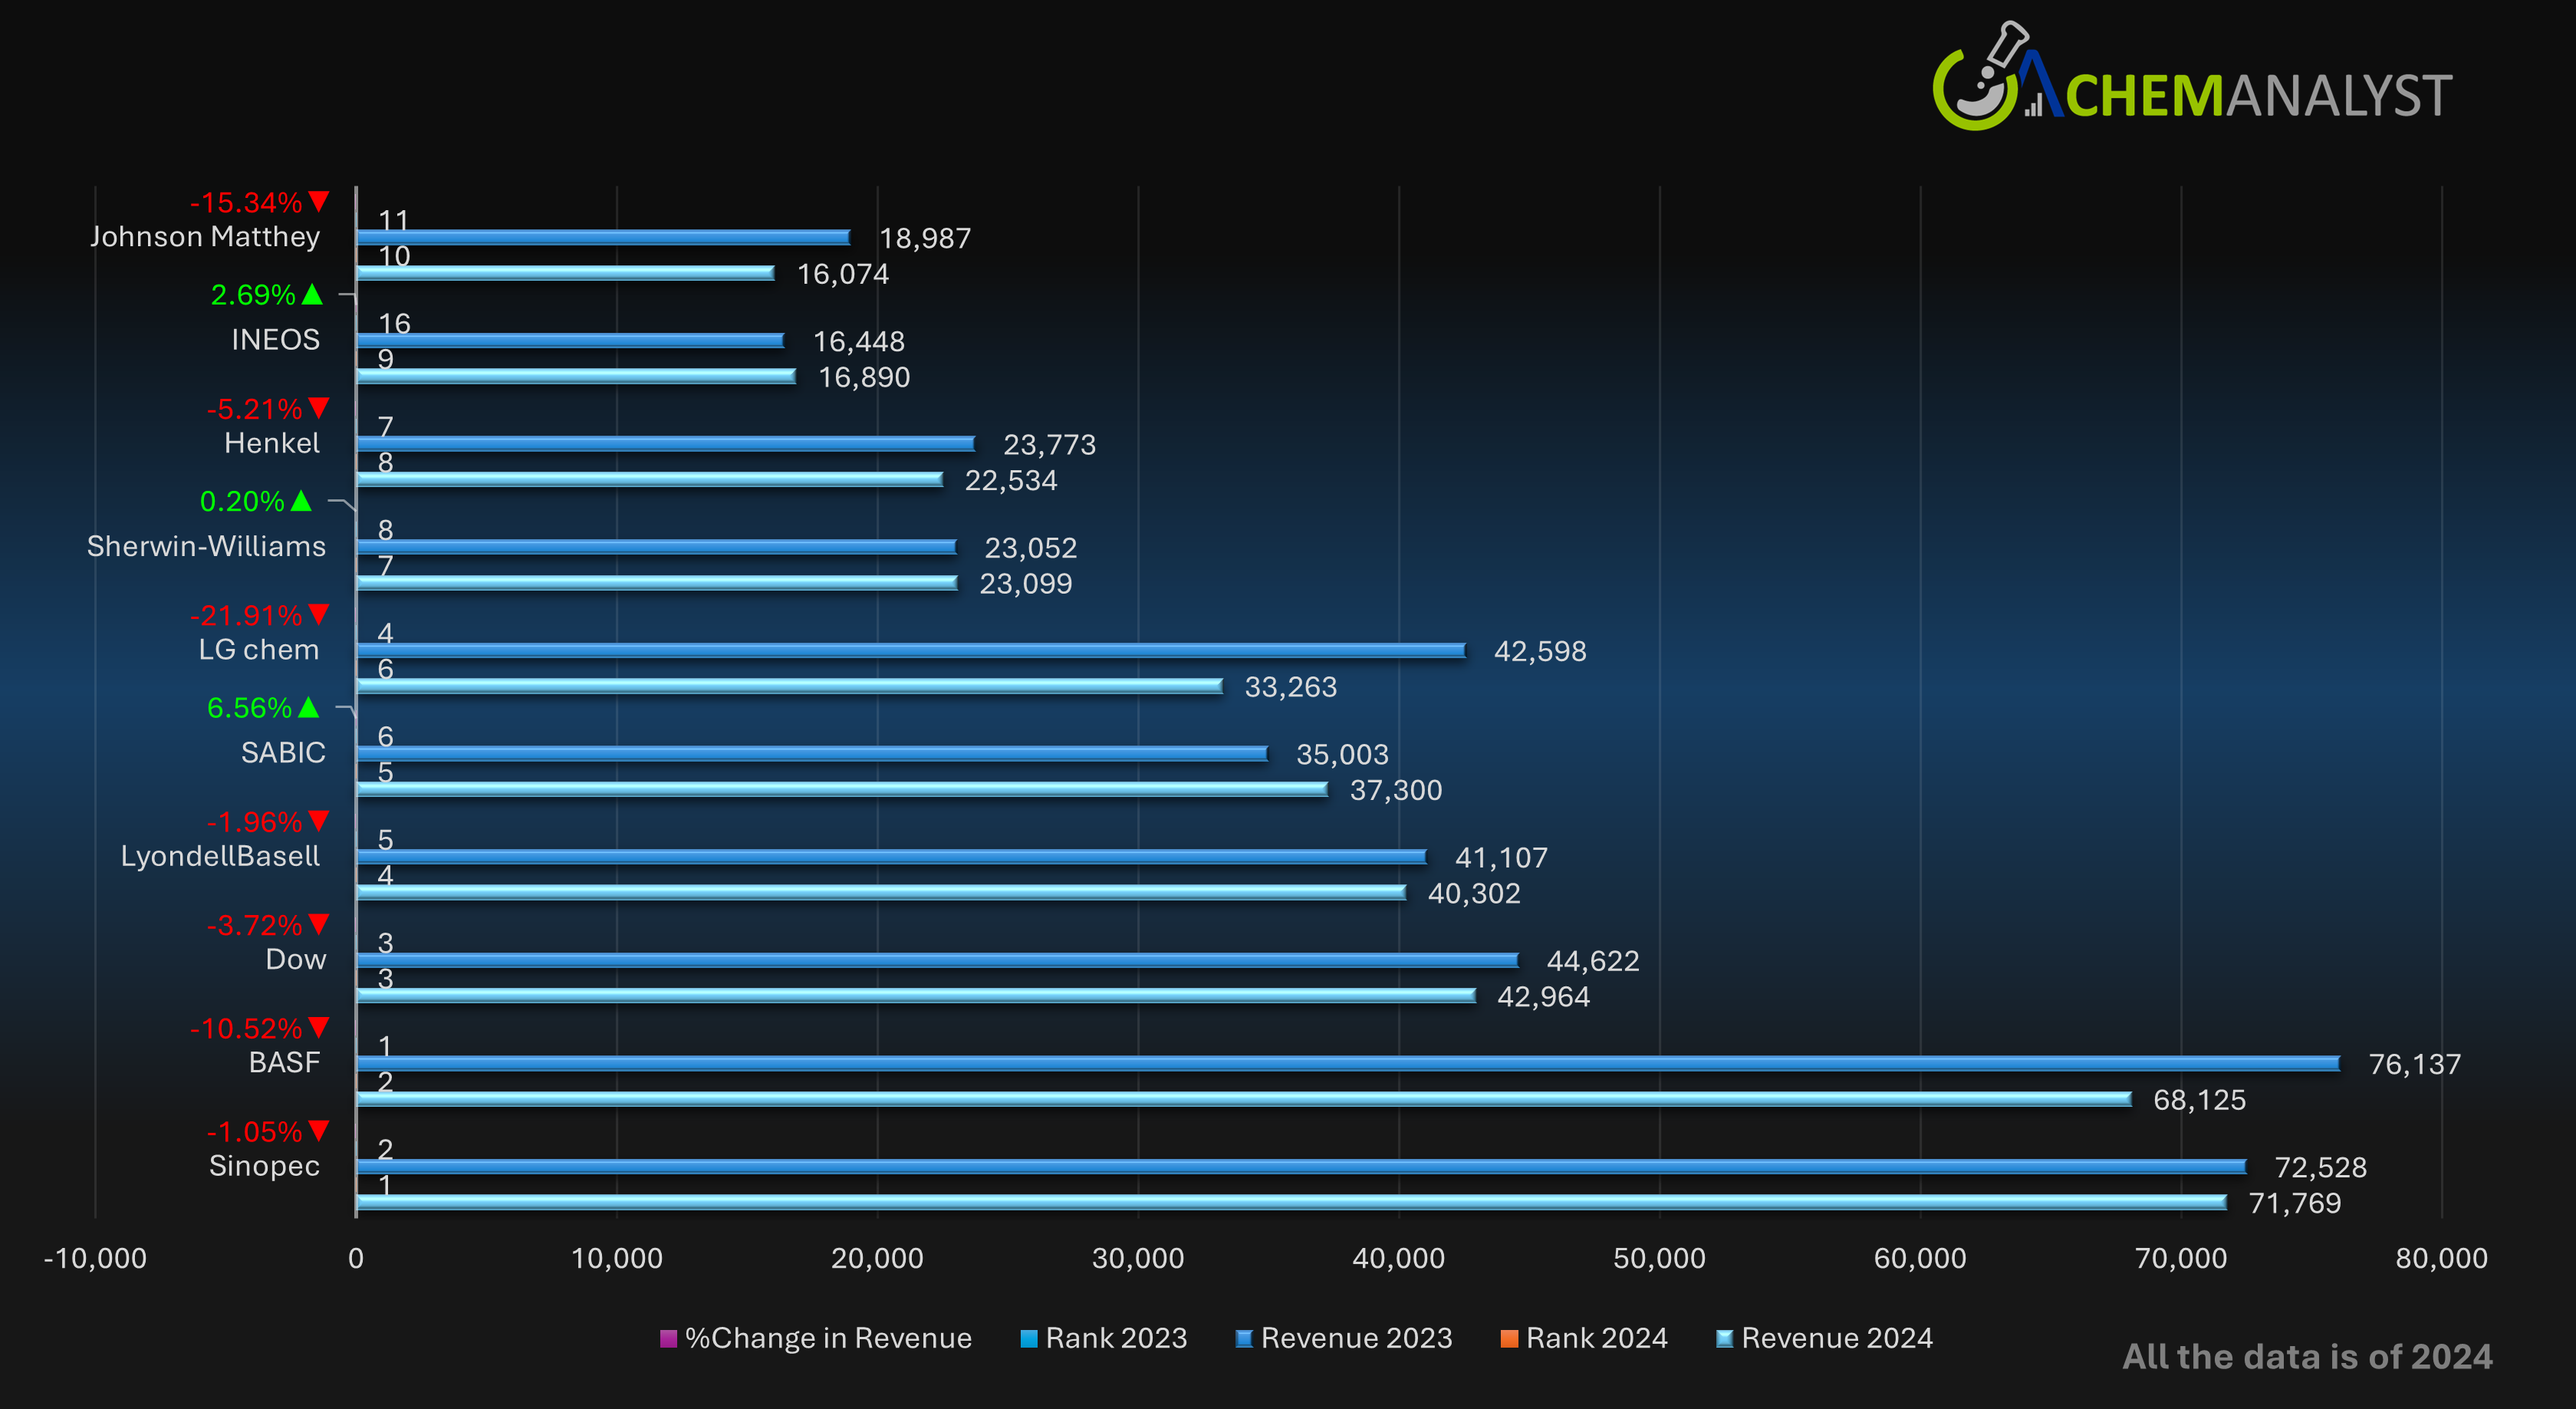
Comparing Top 10 Performers of 2025 with 2024

Comparing Top 10 Performers of 2025 with 2024

The comparison of the top 10 chemical companies by revenue in FY 2023 and FY 2024 reveals notable shifts in rankings and performance. BASF, which led in 2023 with €76,137 million in sales, dropped to second place in 2024 with a significant decline to €68,125 million. In contrast, Sinopec moved up from second to first place despite a slight dip in revenue from €72,528 million to €71,769 million, demonstrating more resilience amid market pressures.

Dow maintained its third-place position with a marginal drop in revenue from €44,622 million to €42,964 million. LyondellBasell climbed one rank, surpassing LG Chem, even though its revenue declined slightly. LG Chem experienced a sharper revenue contraction, falling from €42,598 million to €33,263 million, pushing it down to sixth place.

SABIC saw an increase in revenue from €35,003 million to €37,300 million, climbing from sixth to fifth position. Meanwhile, companies like Sumitomo Chemicals and Shin-Etsu Chemical, which were in the top 10 in 2023, dropped off the list in 2024. They were replaced by INEOS and Johnson Matthey, which entered ninth and tenth place respectively.

Overall, the data reflects a challenging year for many chemical giants, with nearly all experiencing revenue contractions and reordering in rankings driven by regional performance, raw material costs, and shifting global demand.

Research Methodology

The research methodology employed involved compiling a comprehensive list of major chemical manufacturing companies worldwide and analyzing their balance sheets for the year 2024. The ranking of companies was based solely on their sales or revenue earned during 2024. However, some companies released their financial reports according to their fiscal year ending in 2024. Companies that had multiple businesses were included in the list, but only the chemical segment was taken into consideration for the ranking. Companies that were involved in manufacturing fertilizers, pharmaceuticals, and specialty gases were either excluded from the list or had their chemical segment focused upon. Several companies, that had chemical manufacturing as a major business segment, had to be excluded from the list due to an unclear segmentation of the chemical domain in their annual financial releases.

The ranking was also done on the basis of percentage change in performance compared to the previous year (2023). However, companies that faced losses during the previous year were skipped, as an improvement shown in percentage change would give a wrong indication of their performance. Only important financial aspects, such as sales or revenue, EBIT (earnings before interest and taxes)/Operating Income, R&D (research and development) expenses, Capital expenditures (CAPEX), and net income, were taken into consideration. These financial indicators were also compared with the previous year (2022), and a percentage change was calculated. Analyzing these financial indicators can help to understand the actual performance of the company. However, some important financial indicators had to be skipped due to different approaches by some companies in demonstrating their financials, as they were not clearly mentioned in their annual press releases.

Furthermore, all currencies were converted into USD, based on the conversion rate on December 31, 2024, in order to maintain a level playing field for all the companies.

Disclaimer

The information provided in this ranking is intended to be informative and should not be relied upon as the sole factor in making any financial decisions. It is important to note that each country may have its own unique financial reporting regulations and that companies may use various methods to present their financial performance. Therefore, discrepancies in reported values may occur. While every effort has been made to generate this ranking using the most appropriate and relevant approach, any suggestions or feedback to improve its accuracy are welcome.